TORONTO - November 2, 2023 - Lumine Group Inc. (“Lumine Group” or “the Company”) announces financial results for the three and nine months ended September 30, 2023. All amounts referred to in this press release are in US dollars unless otherwise stated.
The following press release should be read in conjunction with the Company’s unaudited condensed consolidated interim financial statements for the three and nine months ended September 30, 2023, management’s discussion and analysis (“MD&A”) for the three and nine months ended September 30, 2023, the audited consolidated financial statements of Lumine Group (Holdings) Inc. (“Lumine Holdings”) for the year ended December 31, 2022, and the Company’s MD&A for the year ended December 31, 2022, all of which can be found on SEDAR+ at www.sedarplus.ca. Additional information about Lumine Group is also available on SEDAR+ and on Lumine Group’s website www.luminegroup.com.
Q3 2023 Headlines:
- Revenue grew 99% to $131.3 million compared to $66.0 million in the same quarter prior year (including 4% organic growth after adjusting for foreign exchange impacts).
- The Company generated operating income of $45.1 million during the quarter, a 107% increase from $21.8 million in the same quarter prior year.
- An expense of $194.8 million was incurred in the quarter related primarily to the increase in fair value of the redeemable preferred and special securities, of which, $174.6 million is related to the convertible shares and $20.2 million is related to the dividend payable. Fair value of the preferred and special securities is primarily dependent on the price movement of the Company’s subordinate voting shares.
- The Company generated a net loss of $179.0 million during the quarter, from net income of $11.8 million in the same quarter prior year. The net loss is primarily related to the redeemable preferred and special securities expense.
- Cash flows from operations (“CFO”) increased $32.4 million to $44.5 million compared to $12.1 million in Q3 2022, representing an increase of 269%.
- Free cash flow available to shareholders (“FCFA2S”) increased $28.3 million to $39.6 million compared to $11.3 million in Q3 2022, representing an increase of 251%.
Year-to-Date Q3 2023 Headlines:
- Revenue grew 90% to $356.6 million compared to $187.5 million in the same nine-month period prior year (including 2% organic growth after adjusting for foreign exchange impacts).
- The Company generated operating income of $103.1 million in the nine-month period ended September 30, 2023, an increase of 82% from $56.7 million in the same period prior year.
- An expense of $1,346.0 million was incurred in the nine-month period ended September 30, 2023 related to the increase in fair value of the redeemable preferred and special securities, of which, $1,297.7 million is related to the convertible shares and $48.3 million is related to the dividend payable. Fair value of the preferred and special securities is primarily dependent on the price movement of the Company’s subordinate voting shares.
- The Company generated a net loss of $1,320.2 million during the nine-month period ended September 30, 2023, from net income of $28.5 million in the same period prior year. The net loss is primarily related to the redeemable preferred and special securities expense.
- CFO increased $56.9 million to $81.9 million compared to $25.0 million in the nine-month period ended September 30, 2022, representing an increase of 227%.
- FCFA2S increased $46.0 million to $68.6 million compared to $22.6 million in the nine-month period ended September 30, 2022, representing an increase of 203%.
Total revenue for the three months ended September 30, 2023 was $131.3 million, an increase of 99%, or $65.3 million, compared to $66.0 million for the comparable period in 2022. For the nine months ended September 30, 2023, total revenue was $356.6 million, an increase of 90%, or $169.1 million, compared to $187.5 million for the comparable period in 2022. The increase for the three and nine month periods is primarily attributable to growth from acquisitions. The Company experienced organic growth of 6% and 1% for the three months and nine months ended September 30, 2023, respectively, or 4% and 2%, respectively, after adjusting for foreign exchange impacts. For acquired companies, organic growth is calculated as the difference between actual revenues achieved by each business in the financial period following acquisition, compared to the estimated revenues they achieved in the corresponding financial period preceding the date of acquisition by the Company. Organic growth is not a standardized financial measure and might not be comparable to measures disclosed by other issuers.
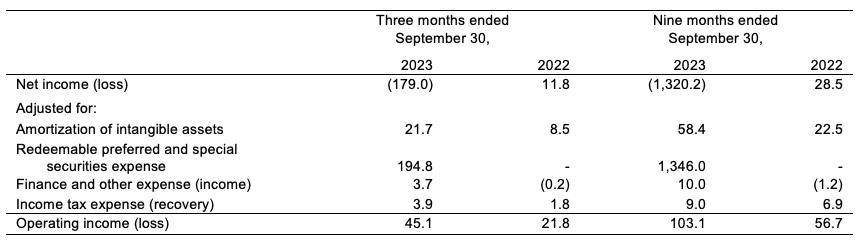
Operating income for the three months ended September 30, 2023 was $45.1 million, an increase of 107%, or $23.3 million, compared to $21.8 million for the same period in 2022. Operating income for the nine months ended September 30, 2023 was $103.1 million, an increase of 82%, or $46.4 million, compared to $56.7 million for the same period in 2022. The increase for the three and nine month periods is primarily attributable to growth from acquisitions. Operating income is not a standardized financial measure and might not be comparable to measures disclosed by other issuers. See “Non-IFRS Measures”.
Net loss for the three months ended September 30, 2023 was $179.0 million compared to net income of $11.8 million for the same period in 2022. Net loss for the nine months ended September 30, 2023 was $1,320.2 million compared to net income of $28.5 million for the same period in 2022. The decrease in net income for the three and nine month periods is primarily attributable to an expense of $194.8 million for the three months ended September 30, 2023 and $1,346.0 million for the nine months ended September 30, 2023 related to fair value adjustments and accrued dividends on the redeemable preferred and special securities issued in relation to the acquisition of WideOrbit and public listing of Lumine Group.
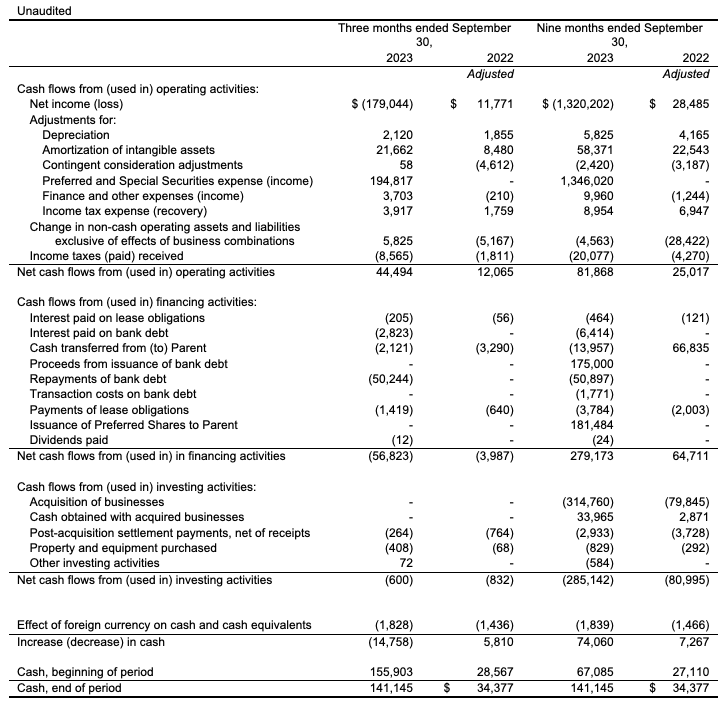
For the three months ended September 30, 2023, CFO increased $32.4 million to $44.5 million compared to $12.1 million for the same period in 2022 representing an increase of 269%. For the nine months ended September 30, 2023, CFO increased $56.9 million to $81.9 million compared to $25.0 million for the same period in 2022 representing an increase of 227%. The primary reason for the increase is that CFO includes the impact of changes in non-cash operating assets and liabilities exclusive of effects of business combinations or, changes in non-cash operating working capital (“NCOWC”) which improved during the nine months ended September 30, 2023 compared to the same period prior year.
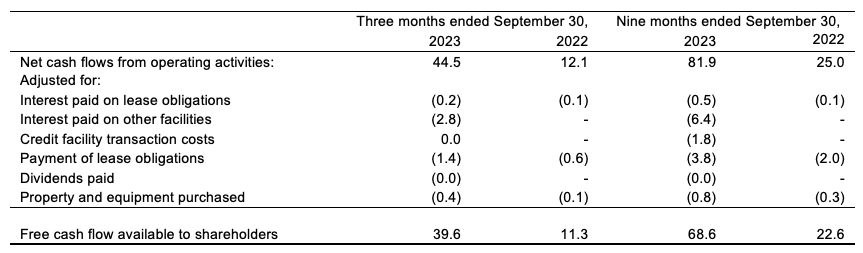
For the three months ended September 30, 2023, FCFA2S increased $28.3 million, or 251%, to $39.6 million compared to $11.3 million for the same period in 2022. For the nine months ended September 30, 2023, FCFA2S increased $46.0 million, or 203%, to $68.6 million compared to $22.6 million for the same period in 2022. The increase is primarily a result of higher CFO during the period. FCFA2S is not a standardized financial measure and might not be comparable to measures disclosed by other issuers. See “Non-IFRS Measures”.
Non-IFRS Measures
Operating income (loss) refers to income (loss) before income taxes, amortization of intangible assets, redeemable Preferred and Special Share expense, and finance and other expenses (income). We believe that operating income is useful supplemental information as it provides an indication of the profitability of the Company related to its core operations. Operating income (loss) is not a recognized measure under IFRS and may not be comparable to similar financial measures disclosed by other issuers. Accordingly, readers are cautioned that operating income (loss) should not be construed as an alternative to net income (loss).
The following table reconciles operating income to net income:
Free cash flow available to shareholders ‘‘FCFA2S’’ refers to net cash flows from operating activities less interest paid on lease obligations, interest paid on bank debt, transaction costs on bank debt, repayments of lease obligations, dividends paid to redeemable preferred and special securities holders, and property and equipment purchased. The Company believes that FCFA2S is useful supplemental information as it provides an indication of the uncommitted cash flow that is available to shareholders if Lumine Group does not make any acquisitions, or investments, and does not repay any debts. While the Company could use the FCFA2S to pay dividends or repurchase shares, the Company’s objective is to invest all of its FCFA2S in acquisitions which meet the Company’s hurdle rate.
FCFA2S is not a recognized measure under IFRS and may not be comparable to similar financial measures disclosed by other issuers. Accordingly, readers are cautioned that FCFA2S should not be construed as an alternative to net cash flows from operating activities.
The following table reconciles FCFA2S to net cash flows from operating activities:
Forward Looking Statements
Certain statements herein may be “forward looking” statements that involve known and unknown risks, uncertainties and other factors that may cause the actual results, performance or achievements of Lumine Group or the industry to be materially different from any future results, performance or achievements expressed or implied by such forward-looking statements. Forward looking statements involve significant risks and uncertainties, should not be read as guarantees of future performance or results, and will not necessarily be accurate indications of whether or not such results will be achieved. A number of factors could cause actual results to vary significantly from the results discussed in the forward looking statements. These forward looking statements reflect current assumptions and expectations regarding future events and operating performance and are made as of the date hereof and Lumine Group assumes no obligation, except as required by law, to update any forward looking statements to reflect new events or circumstances.
About Lumine Group Inc.
Lumine Group acquires, strengthens, and grows, vertical market software businesses in the communications and media industry. Learn more at www.luminegroup.com.
For further information:
David Nyland
Chief Executive Officer
Lumine Group
david.nyland@luminegroup.com
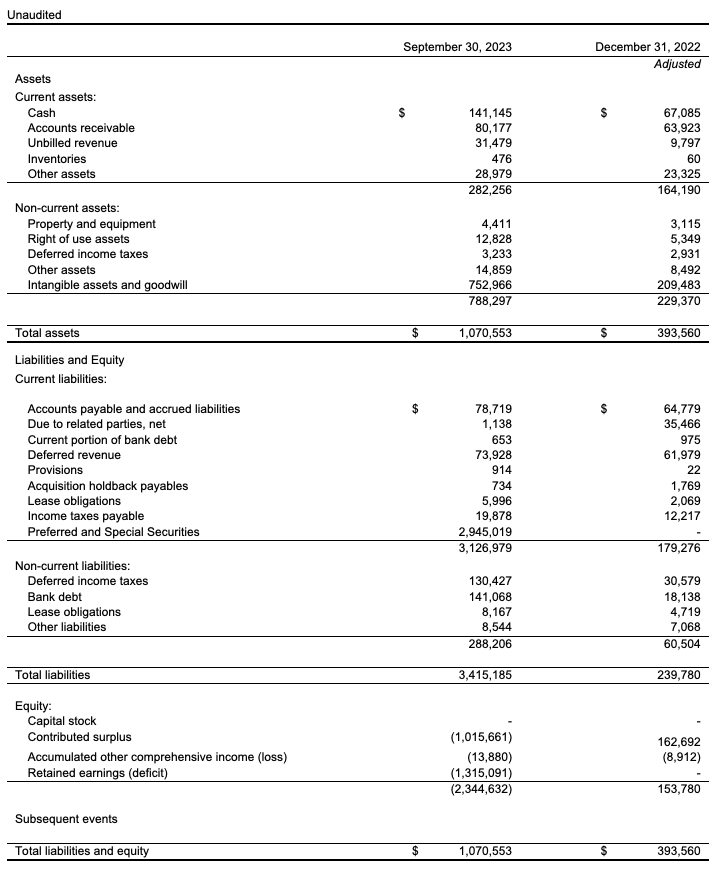
Condensed Consolidated Interim Statements of Financial Position
(In thousands of USD. Due to rounding, numbers presented may not foot.)
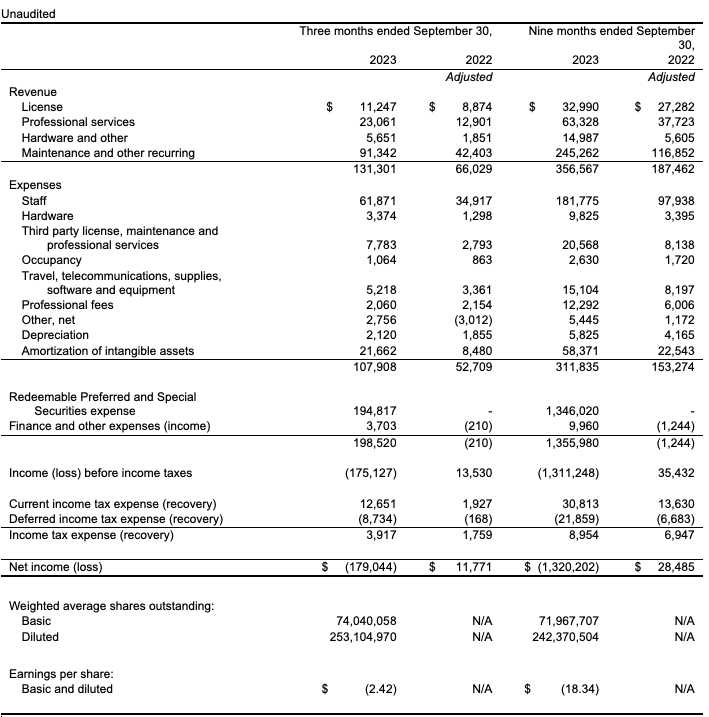
Condensed Consolidated Interim Statements of Income (Loss)
(In thousands of USD, except per share amounts. Due to rounding, numbers presented may not foot.)
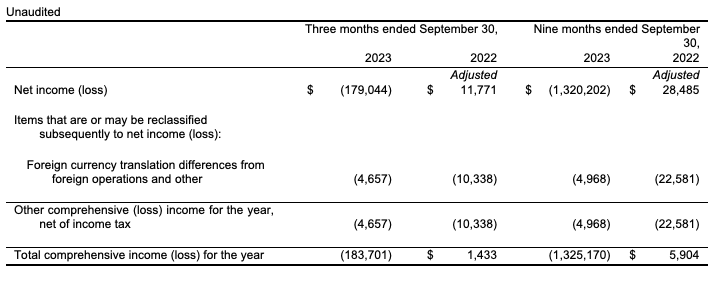
Condensed Consolidated Interim Statements of Comprehensive Income (Loss)
(In thousands of USD. Due to rounding, numbers presented may not foot.)
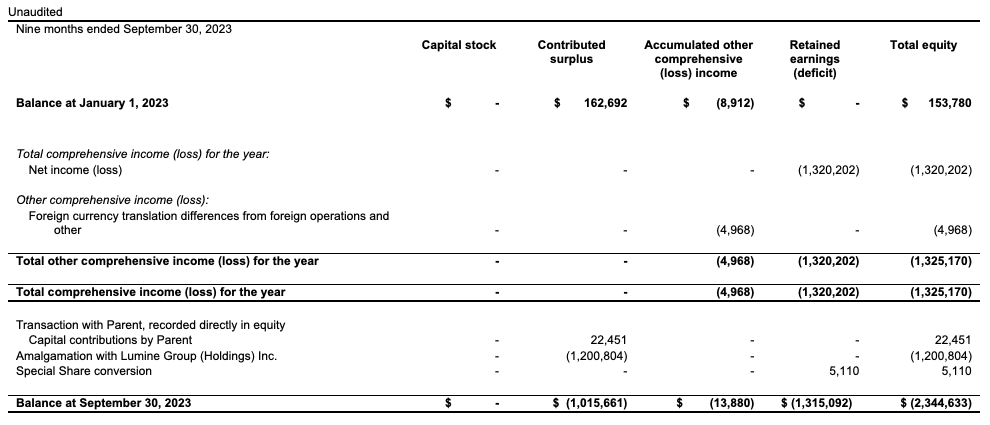
Condensed Consolidated Interim Statement of Changes in Equity
(In thousands of USD. Due to rounding, numbers presented may not foot.)
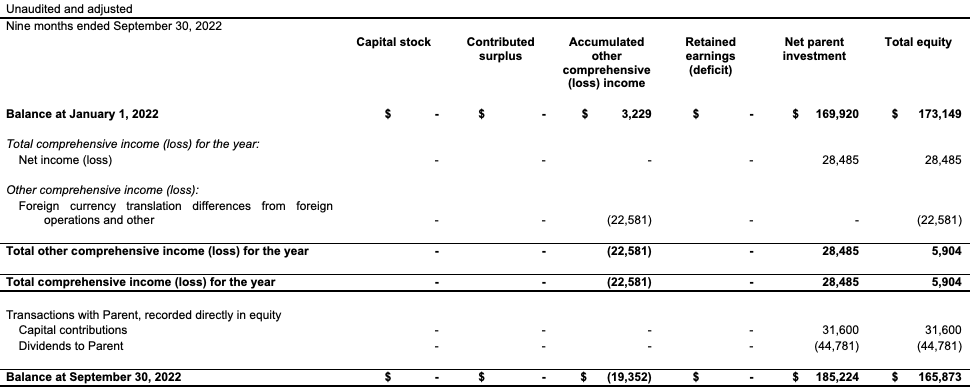
Condensed Consolidated Interim Statement of Changes in Equity
(In thousands of USD. Due to rounding, numbers presented may not foot.)
Condensed Consolidated Interim Statements of Cash Flows
(In thousands of USD. Due to rounding, numbers presented may not foot.)